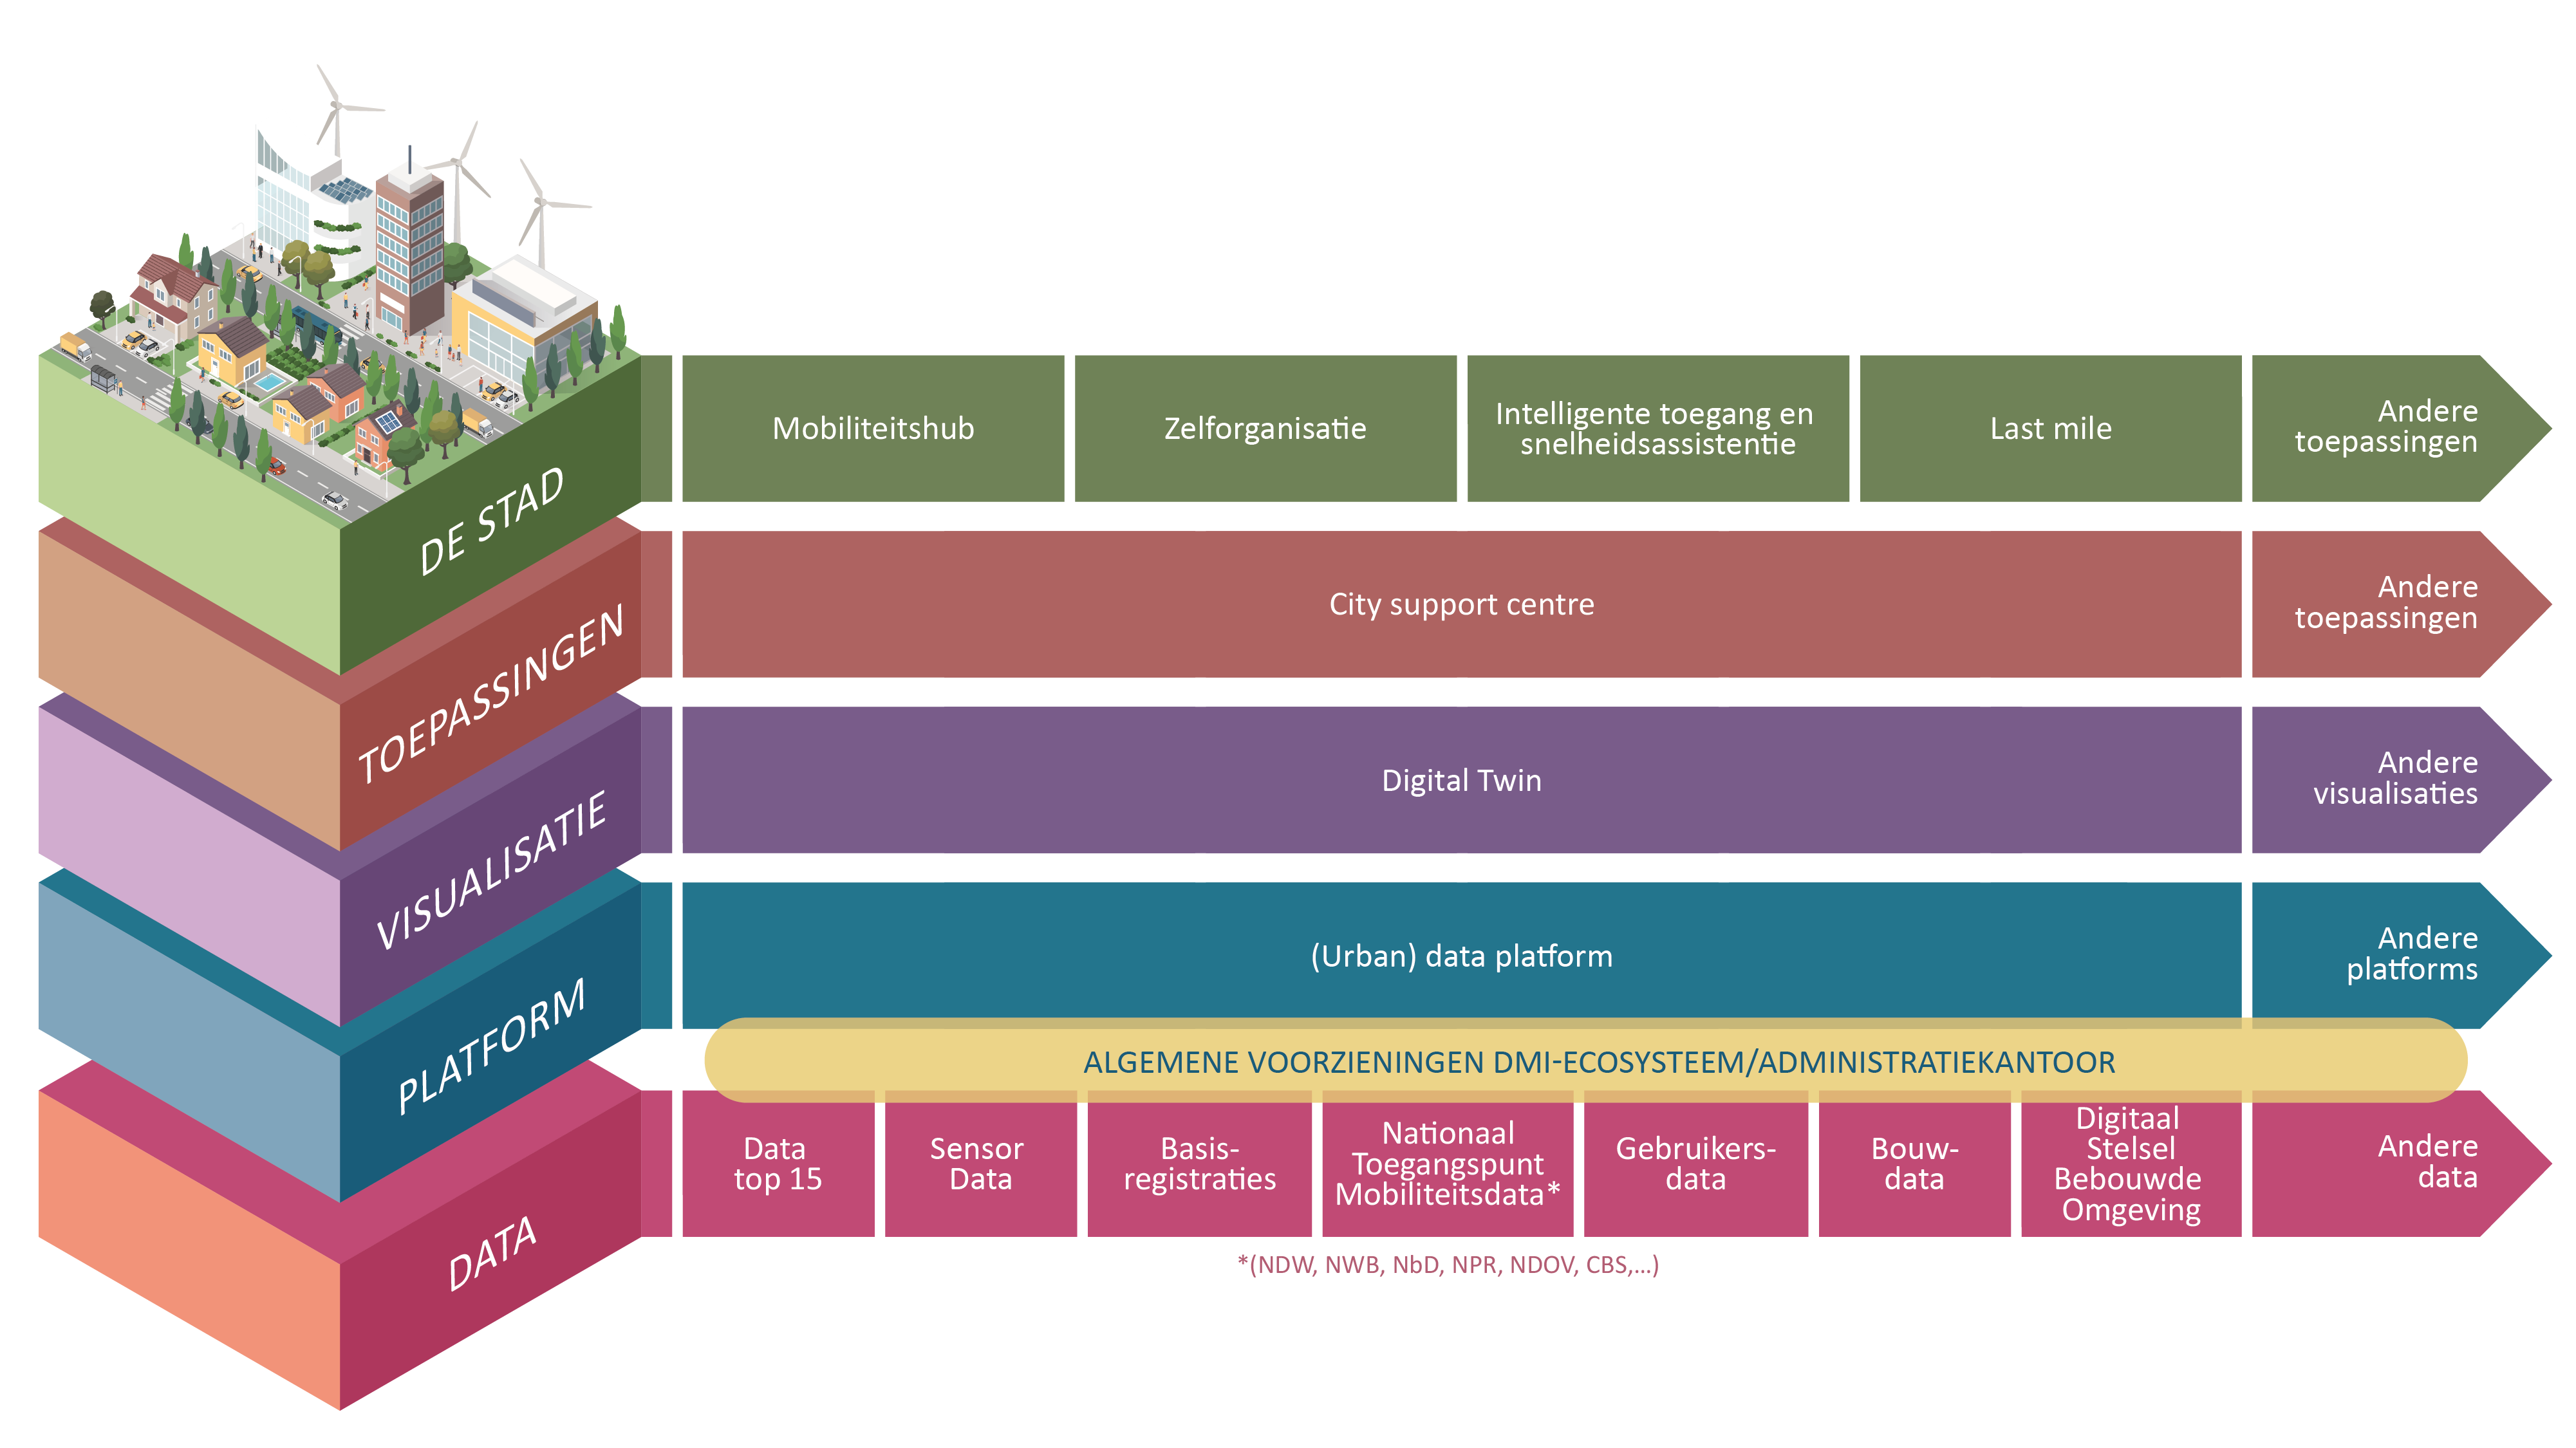
Functioning DMI-ecosystem.

As a municipality, you ideally make policy based on data. But raw data is not suitable to base choices on: that data must first be translated into understandable and relevant information. The image above shows the successive steps to get from data to usable information. Within the DMI-ecosystem, we ensure that each supplier on each layer can more easily collaborate with suppliers on adjacent layers. And that multiple suppliers can act on each layer. One way we do this is through the Appointment System.

Thus, we provide scalable standards-based solutions so that every city can quickly and easily use the right solutions.

Layer plate DMI-ecosystem

The layers of the DMI-ecosystem.

To arrive at digital solutions, data goes through several stages: from raw data (shown in the bottom layer in the image below) from a variety of sources and domains, to a platform (layer 2) where the data is enriched by merging with other data, to a representation in the form of information on a map, a 3D view or graph (layer 3). In a city support center (layer 4), you can use data to perform analyses, develop scenarios, compile dashboards and create cut-outs from the available information. The General Facilities of the DMI-ecosystem ensure that data can be used securely and reliably. Click on the spheres on the right side of the image below for an explanation of each layer.

Added value of the DMI-ecosystem.

When a municipality has an application created to understand, for example, flood risk for their city, they do so with their vendors. However, this application cannot then be used by other cities because they have their own suppliers and IT systems with their own standards. The collaboration within the DMI-ecosystem ensures that every supplier at every layer can easily collaborate with suppliers in other layers, so that solutions are scalable and every city can use them.

Participating parties within the ecosystem cooperate with each other based on a common interest. The Appointment System creates a basis of trust, and enables data to be handled reliably, while maintaining data sovereignty.

Finally, the collaboration within the DMI-ecosystem ensures (more) availability of (better) data, enabling new and better solutions.

Portrait photo of Sonja Hulshoff

Your point of contact

Do you want to know more? Then please contact Sonja Hulshoff, theme leader of Knowledge.

  The DMI-ecosystem is designed to help cities become more sustainable in an integrated way and to support companies in scaling up new solutions. In doing so, we deploy all the possibilities of information technology. And knowledge and knowledge use are then essential in both the physical and digital worlds. 

Collaborate on scalable solutions and responsible use of data

general calendar

Layer 5: The City

In the city, based on the insights from the City Support Centre, specific measures can be taken or activated on the street, whether fully automatic or not. Think, for example, of sending messages to approaching visitors, advising them to get off the train at a specific station to continue their journey by bus or streetcar. Or the advice to park the car in a hub on the edge of the city, because half an hour before arrival the parking garage at the destination is expected to be full. Or advising residents of a specific neighborhood not to park cars in the street because flooding is expected. Residents and e.g. employers can be part of making the problem analyses and the new solutions and choices that then follow with insights and scenarios from the start of a planning process or design issue.

Layer 4: Applications

In this layer we find the City Support Centres, which can be used to develop scenarios and perform analyses on the data and information from previous layers in a simple and accessible way. To use the example of the bus: in the City Support Centre, you can see which trains the bus line connects to, which neighborhoods are or are not served by different bus lines, and whether in certain situations or at certain times there could be problems regarding hospital accessibility. The City Support Center provides answers to questions such as, "What happens here in the use of public space?" and "What happens in energy use?" and "What are the effects if those offices near Nachtwachtlaan were to be given a residential or green space function?"

Layer 3: Visualization

To derive information from the data from the various platforms in an accessible way, you want to be able to plot them on a map, for example, so that you can - literally and figuratively - also have a picture to go with it. This can be done, for example, with the digital twins found in this layer 3. These can offer a simple 2D map, but a much more elaborate version with much more detail and virtual 3D animation is also possible. Take the location of a bus as an example: the platform in layer 2 gives you the GPS coordinates of the bus, in the visualization layer you can see that it is bus 5, which stops at 15:00 at the Nachtwachtlaan stop.

Layer 2: Platform

On the various data platforms found in this layer, data is validated, harmonized, merged with other data, enriched and reprocessed. You can compare each of these platforms to a power strip, which allows data from different sources to be brought together from the bottom layer.

Layer 1: Data

In the bottom layer, we see the various sources of data, such as the NTM for mobility data, a series of basic registries in multiple domains, and diverse sensors from which data becomes available. So this layer involves data coming from many different data domains, from energy and water resources to geography and sociology.
Skip to content